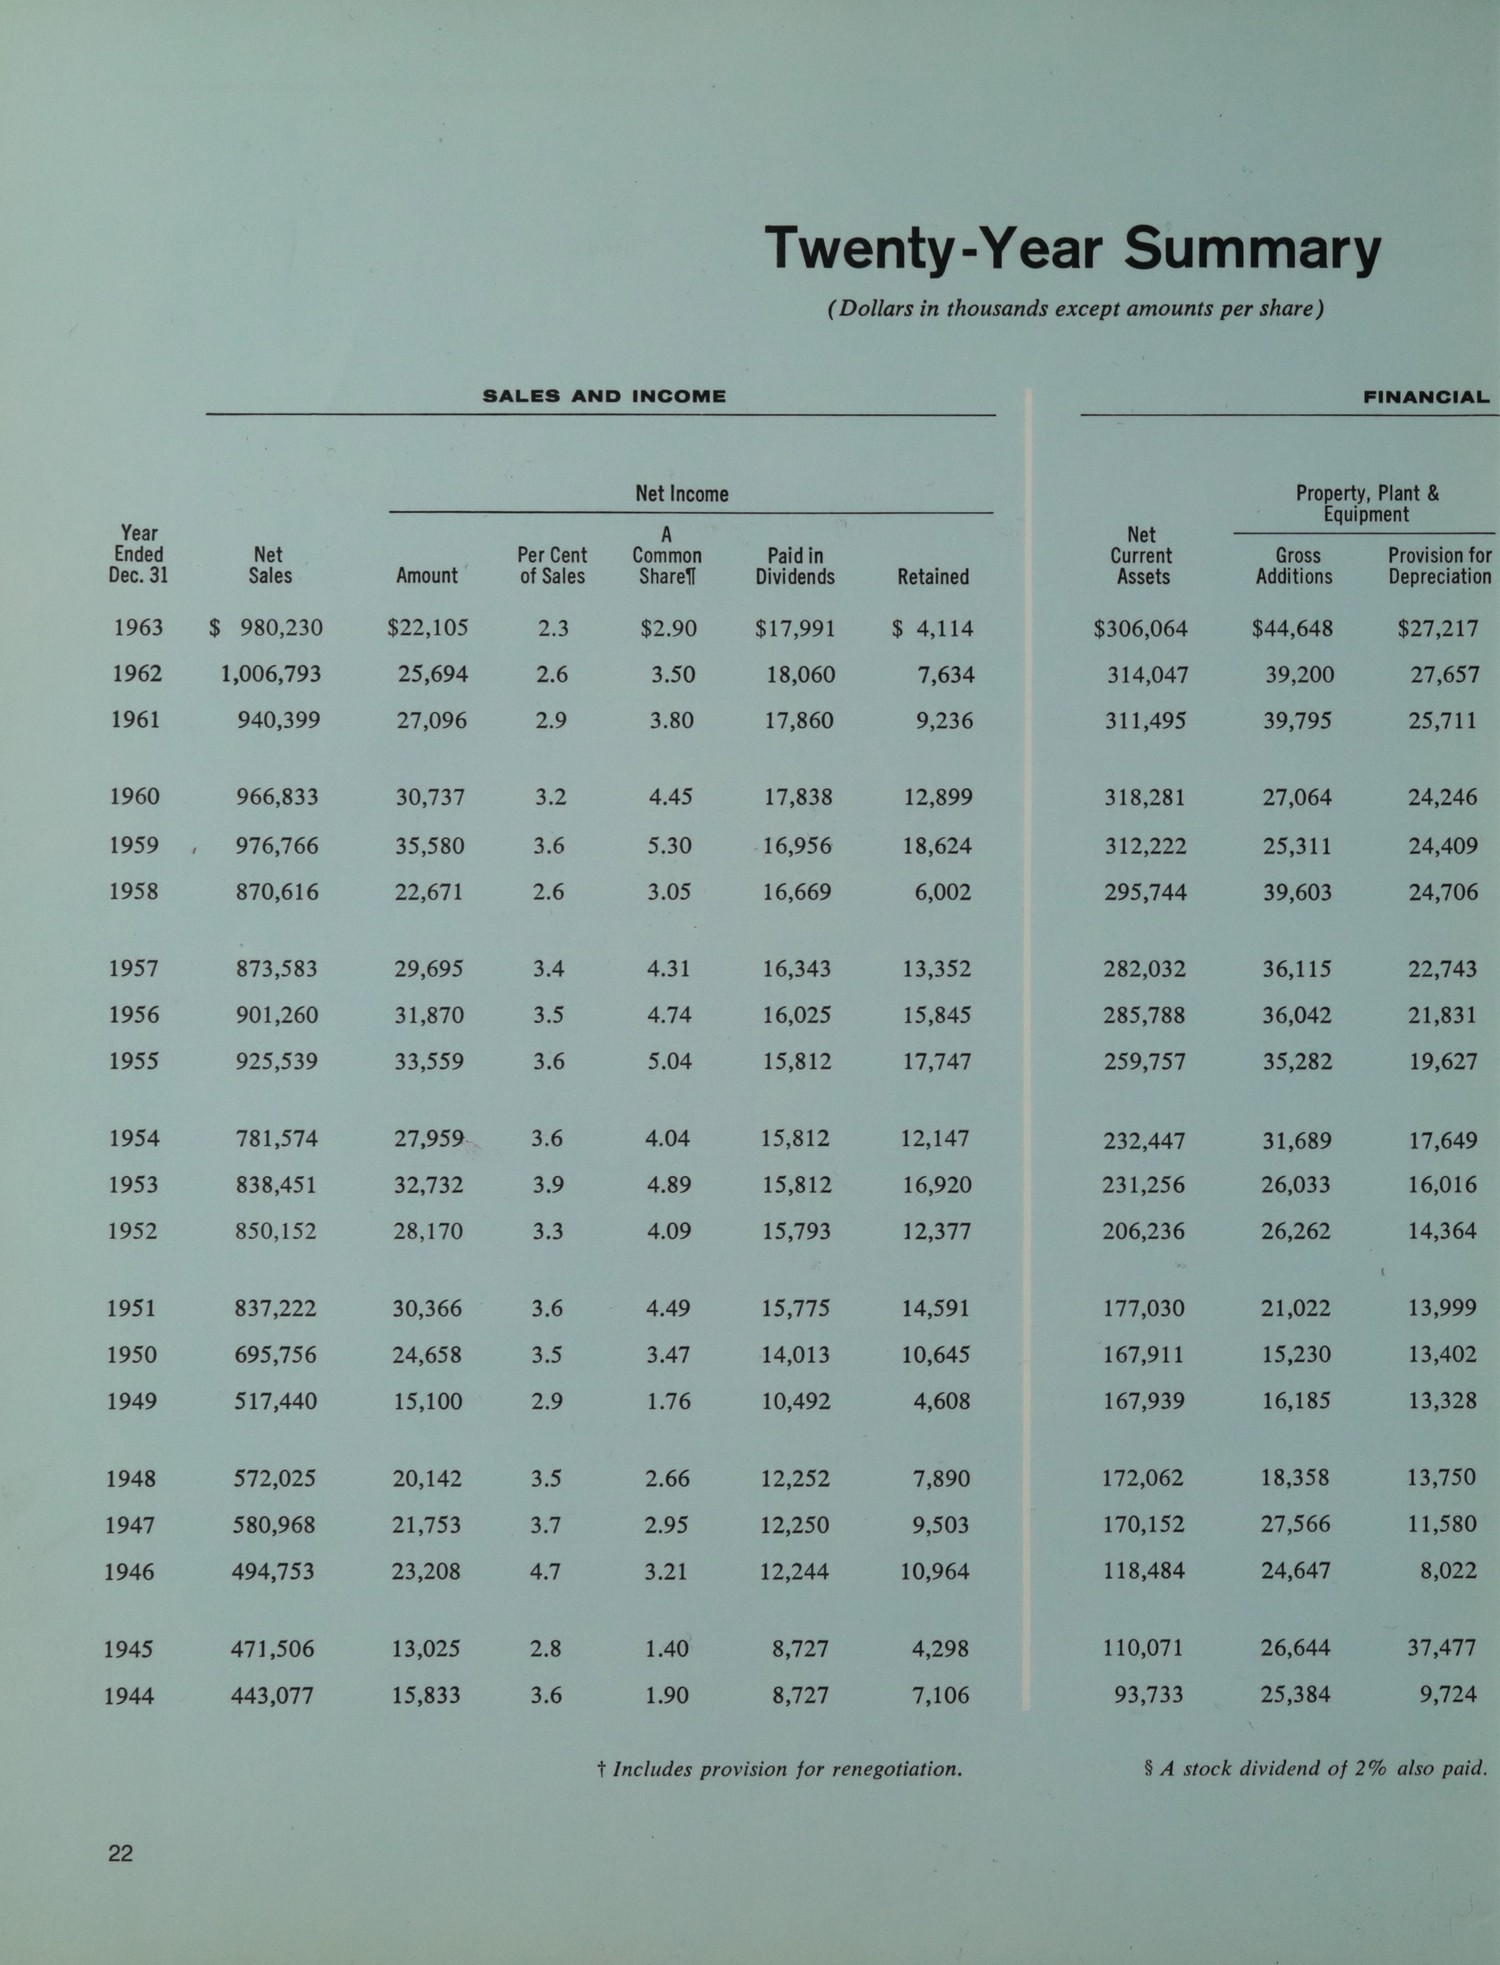
Twenty-Year Summary
(Dollars in thousands except amounts per share)
SALES AND INCOME FINANCIAL
Year Net Per Cent Paid in Property, Plant &
Ended Sales Net of Sales Dividends Equipment
Dec. 31 Amount Common Retained Net Gross Provision for
1963 $ 980,230 $22,105 2.3 $17,991 $ 4,114 $306,064 $44,648 $27,217
1962 1,006,793 25,694 2.6 18,060 7,634 314,047 39,200 27,657
1961 940,399 27,096 2.9 17,860 9,236 311,495 39,795 25,711
1960 966,833 30,737 3.2 17,838 12,899 318,281 27,064 24,246
1959 , 976,766 35,580 3.6 16,956 18,624 312,222 25,311 24,409
1958 870,616 22,671 2.6 16,669 6,002 295,744 39,603 24,706
1957 873,583 29,695 3.4 16,343 13,352 282,032 36,115 22,743
1956 901,260 31,870 3.5 16,025 15,845 285,788 36,042 21,831
1955 925,539 33,559 3.6 15,812 17,747 259,757 35,282 19,627
1954 781,574 27,959 3.6 15,812 12,147 232,447 31,689 17,649
1953 838,451 32,732 3.9 15,812 16,920 231,256 26,033 16,016
1952 850,152 28,170 3.3 15,793 12,377 206,236 26,262 14,364
1951 837,222 30,366 3.6 15,775 14,591 177,030 21,022 13,999
1950 695,756 24,658 3.5 14,013 10,645 167,911 15,230 13,402
1949 517,440 15,100 2.9 10,492 4,608 167,939 16,185 13,328
1948 572,025 20,142 3.5 12,252 7,890 172,062 18,358 13,750
1947 580,968 21,753 3.7 12,250 9,503 170,152 27,566 11,580
1946 494,753 23,208 4.7 12,244 10,964 118,484 24,647 8,022
1945 471,506 13,025 2.8 8,727 4,298 110,071 26,644 37,477
1944 443,077 15,833 3.6 8,727 7,106 93,733 25,384 9,724
† Includes provision for renegotiation.
$ A stock dividend of 2% also paid.